We are Pan and Jen, Data Scientists in the Growth team at Monzo. Our role is all about understanding why customers choose to bank with Monzo, and how we can use data to inform strategies to continue our amazing growth trajectory (we currently have 13 million customers and counting).
This post is all about our Growth (i.e. acquisitions) forecast - how we do it, why it’s useful, and some points you can take forward for your own forecasts.
Why is forecasting so important to us?
At Monzo we’re ambitious, and we want to make money work for everyone. Forecasting helps us to understand whether we’re on track to meet our goals. This might be short-term - knowing what we expect from the next month, or longer term, helping with planning over the next few years.

Knowing whether our growth is on track is really important. If we’re behind where we planned, we need to know why, and more importantly, what we can do about it. We don’t rest on our laurels if we’re smashing forecast either - we dig into what’s driven performance so we can do even more of it! But it’s important that our forecasting is accurate - we don’t want to assume we’re doing well at everything when actually we just didn’t do a great job of forecasting.
Why is forecasting a challenge?
If forecasting was easy, all our roles and responsibilities at Monzo would look very different! (Or we’d all be stock-market investors). The fact is, we just don’t know for sure what’s around the corner. However, forecasting can be a really useful early sign that things are different than we expected, so it’s important to give it our best shot.
So what makes it tricky?
Forecasting relies on previous data trends, therefore new marketing campaigns or big changes such as new product launches are hard to predict effectively.
Even where we have good data, we need to understand the ‘why’ behind the trends. For example, changes to Bank of England rates can drive overall interest in savings. This means that a trend won’t necessarily follow the same pattern in future as it did historically.
We forecast for top-line acquisitions as well as performance marketing (the digital ads we run on partner platforms such as Google) and referrals (where our customers get rewarded for recommending their friends to Monzo). The inputs for the forecast can influence these to different degrees, adding complexity.
We see different behavioural patterns for public holidays, for example Christmas Day is our smallest acquisition day in the year! So these need to be included in the forecast.
One of the other challenges is that our forecasts are used for different purposes. As detailed below, we forecast for both the short-term and long-term, with different uses for different teams in the business such as Growth and Marketing, Product and Finance.
How did we approach it?
Before we landed on our current forecasting approach, we explored different methods to strike the right balance between accuracy, flexibility, and ease of implementation.
We considered some simple approaches, such as year-on-year and week-on-week trends or basic time-series extrapolation, but these lacked the ability to account for marketing spend, or other influences like CRM campaigns. Given the dynamic nature of our growth drivers, we needed something more robust and interpretable.
We ultimately chose Prophet, an open-source forecasting tool developed by Meta, because:
It handles seasonality well, which is crucial given how Monzo’s acquisition patterns fluctuate across the year.
It allows us to incorporate external factors like marketing spend and holidays as regressors.
It’s flexible enough for customisation, letting us fine-tune the model to suit our specific needs.
We’re aware that Prophet has received some criticism - particularly around its default settings and performance in complex scenarios. But in our experience, when used thoughtfully and with the right inputs, it performs well. We’ve customised it to reflect how growth really works at Monzo: incorporating custom holidays for one-off campaigns, modelling marketing spend with diminishing returns, and validating the outputs regularly.
It’s not a one-click solution, but it’s been a valuable tool - giving us forecasts that are interpretable, adaptable, and accurate enough to support both day-to-day decision-making and long-term planning.
The juicy details
Once we’d chosen the tool, the next step was configuring it to reflect the key drivers behind our customer acquisition. That meant deciding how to structure the model, which inputs to include, and how to ensure the outputs were both reliable and easy to interpret.
One of the reasons Prophet has worked well for us is that it breaks the forecast into clearly defined components:
Trend – the overall direction of growth over time
Seasonality – regular patterns we see across weeks or months
Extra regressors – external factors that influence growth
Holiday effects – one-off events that temporarily affect growth
This structure helps us make sense of the output and ensures the model stays interpretable - it’s not a black box, but a set of parts we can interrogate individually.
🌀 Trend
The trend component captures the long-term trajectory of customer growth - which is especially important for our multi-year forecasts. It reflects broader structural factors like market demand, product maturity, saturation of our addressable audience, and the long-term impact of our growth strategy.
We use the trend to sense-check whether the model’s long-range projection aligns with our expectations: are we accelerating, slowing down, or reaching a plateau? If the trend looks misaligned - either too flat or too aggressive - we revisit our assumptions, inputs, and sometimes our model configuration to bring it closer to reality.
While we keep an eye on recent developments (like product launches or channel changes), the trend is ultimately about the macro picture - helping us understand whether we’re on track to hit our long-term growth goals.
📅 Seasonality
Growth at Monzo is highly seasonal, and this is one of the areas where Prophet shines. Because it models seasonality using Fourier series, it’s able to pick up on regular, repeating patterns in the data.
Some of our most consistent seasonal spikes happen:
In January, driven by “new year, new me” energy and people switching banks or starting savings goals
In September, when students start university and open their first bank accounts
By capturing these patterns, the model helps us set realistic expectations about when growth will naturally pick up or slow down.
📈 Regressors
While much of Monzo’s growth has historically come from organic channels - especially word of mouth and strong product-market fit - we’ve found that performance marketing spend is one of the more measurable external influences on acquisition volume. That’s why we include it as a regressor in our model.
Rather than assume a purely linear relationship, we model this with diminishing returns - which better reflects reality: more spend helps, but each extra pound has a smaller incremental impact.
Including spend as a regressor helps the forecast respond more accurately to changes in planned spend, and allows us to isolate its influence from other components like trend and seasonality. Looking ahead, we’re exploring whether we can break this down further — for example, by channel or platform.
🏝️ One-off Monzo Growth events (using custom ‘holidays’)
We also make heavy use of Prophet’s custom holidays feature - this is how we model short-term campaigns and events that don’t follow a regular seasonal pattern.
Examples include:
Brand campaigns, like major marketing pushes across digital and offline channels
CRM campaigns, where we nudge customers to refer their friends
Referral promotions, such as when we first introduced the “Give £10, Get £10” offer
These events often cause short, sharp spikes in acquisitions - and we know both the historic and planned dates in advance. Because they don’t follow a regular seasonal pattern, we model them using Prophet’s custom holidays feature.
In Prophet, seasonality is assumed to repeat year after year - but custom holidays are treated as one-off effects. This is exactly what we want for Monzo-specific campaigns, which rarely occur on the same dates or in the same format. By modelling them this way, we can reflect their true short-term impact without letting them distort the trend or inflate future expectations.
How we use it
Sense checking
Forecasting effectively doesn’t end with the output from Prophet. We need to be careful to sense check the forecast we’ve produced. In a fast-moving business, past performance isn’t always indicative of future success.
When it comes to sense-checking, don’t underestimate how well your teams know your business. As data scientists we always encourage testing and accurate measurement, but we also know our colleagues across Marketing, Finance and Product have great knowledge and context. We ask them what’s coming up, what performance uplifts they saw in previous tests, and we also use overall historical trends to make sure it just makes sense.
We also have an extremely useful Marketing Mix Model, which has broken down our historical acquisition performance into component parts. We monitor how these components are changing over time, and make sure that our forecast aligns with what we find.
Short-term forecasting
One of the use cases for the forecast is to set an expectation for each month’s performance. This serves two purposes. It starts as a true forecast for how we expect the month to go, but it also turns into a running reflection of where we expect to end up by the end of the month. This part is very important for a dynamic business like Monzo - if things aren’t going how we expect then we quickly take action to set things back on track.
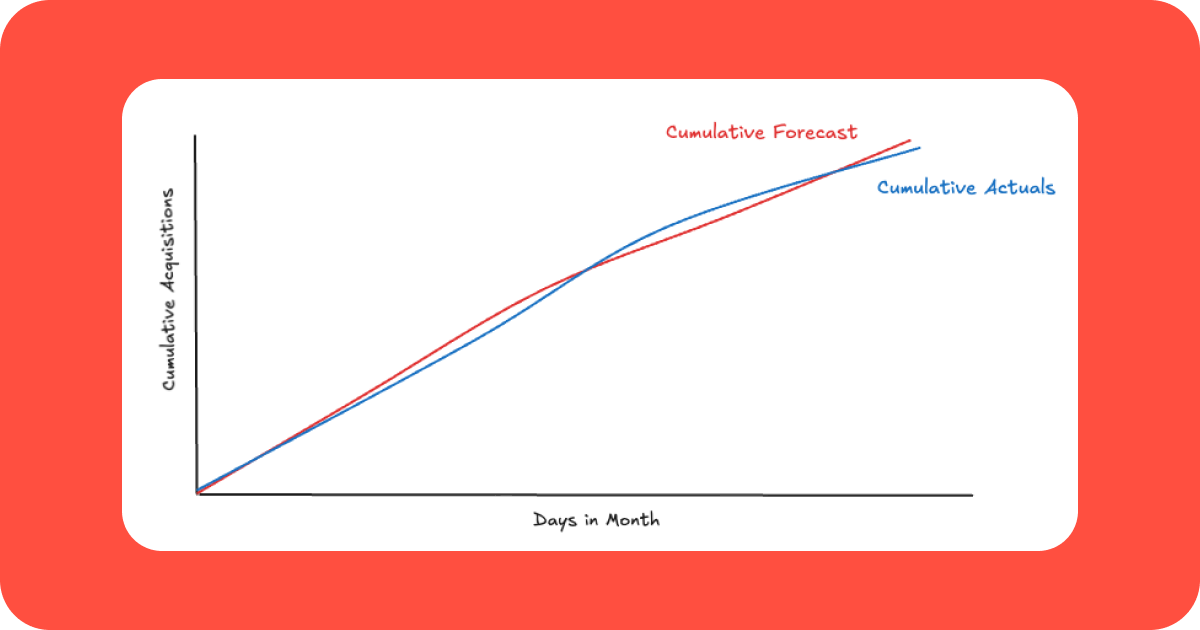
We chose to create a daily forecast, because this means it’s easy for us to roll this up into a weekly or monthly forecast as needed. However, accurate daily forecasting is a challenge. We tend to find that we don’t always get the daily forecast exactly right, but we generally do a good job accurately forecasting the month at a total level.

We often find that daily forecasts can be challenging to get right, but we tend to predict very well over the month as a whole.
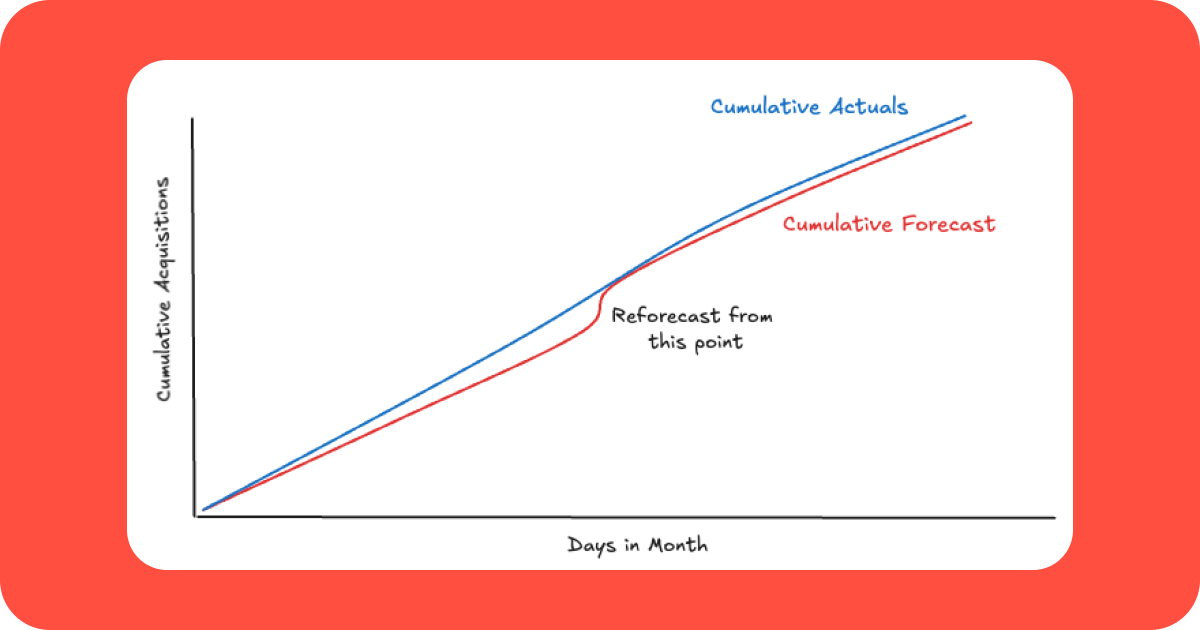
However, if we see a gap to forecast that continues to deviate over time, this would usually trigger a reforecast. We hope that this will usually be because we will beat the forecast!

In this instance it’s very important to analyse what is driving the performance gap, to help understand if it’s a fundamental change (e.g. a new product launch) which could change the trend, or a short-term one, which we can handle as a one-off event. This enables the most up-to-date view of where we will end the month. It’s hugely beneficial to know that what we are doing is working, so we can do more of it!
In 5 of the last 6 months our original forecast has been within our tolerance (~±5%) and our reforecast has been within tolerance for all 6 of those months. Even months where we do not forecast within tolerance we don’t necessarily see this as a ‘failure’ - this informs us that something significant has happened, which we can take the time to analyse and understand.
Long-term forecasting
The other use case is for long-term forecasting and goal setting. This gives us an idea of whether we’re going to achieve our ambitious company goals. However, forecasting inherently becomes less certain, the further forward we look. Therefore we need to use other data sources to understand what contributes to our performance and how they might change in the future. To do this we consider trends of other key features from our Marketing Mix Model, and overall market demand.
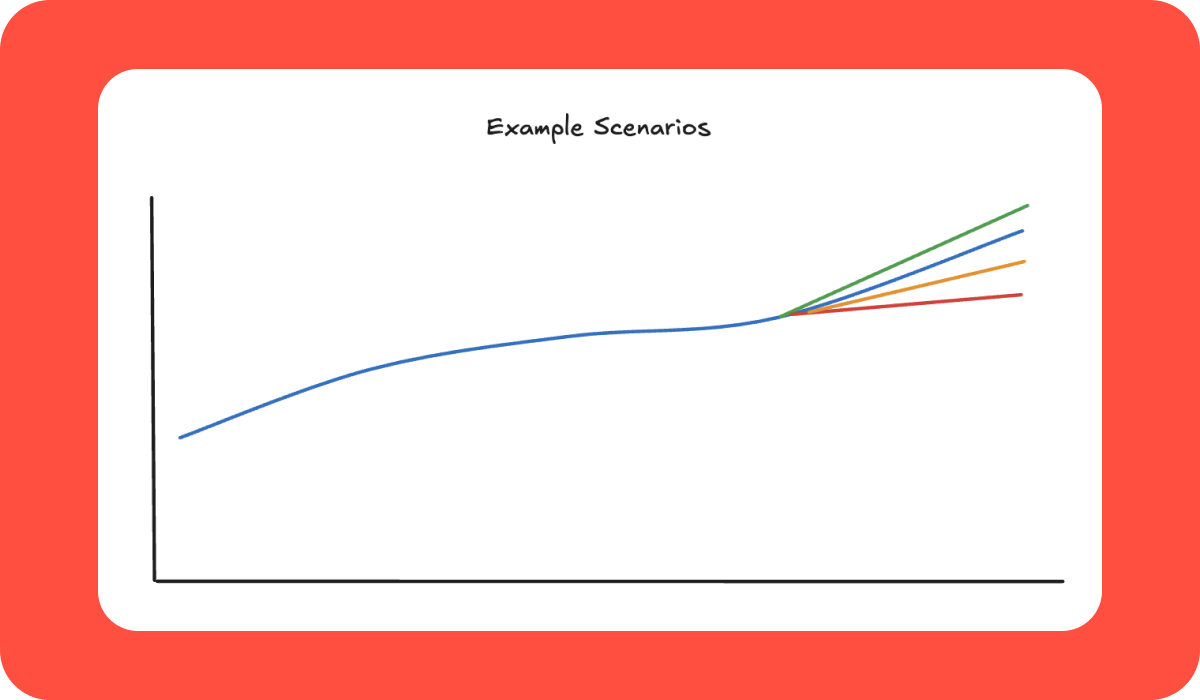
We run scenarios to understand the impacts of the different levers we can pull, such as investing more in marketing ads. We also provide estimates of the potential impact of changes in market demand. We will make recommendations for each scenario, for example by showing how much additional marketing spend we would need to offset a drop in market demand.

We then work with Finance to assess which scenario we think is most likely, and this becomes our set of targets for the next financial year. We repeat this longer-term process every 6 months.
In addition, our product teams overlay expected product adoption rates over our forecast to predict how many customers we would expect to be using our products over time. Variances from these forecasts also help the product teams know when to analyse further or course-correct.
Taking our model to the next level - from Prophet to our very own “ForeSight”
Continuing to own the monthly and longer-term forecasting for Growth & Marketing is only part of the story - the other focus for our team is making the tool itself even better. While our current forecasting setup works well and is already influencing decisions across the business, there’s still a lot we want to improve to make it more flexible, scalable, and future-proof.
🧱 Building for reusability
At the moment, running a forecast involves a fair bit of manual work - especially when we want to adjust parameters for different time horizons or segments. One of our immediate goals is to modularise the code into Python functions, so it’s easier to reuse across different contexts. This will make the tool more robust and also more accessible for other data teams who might want to plug it into their own workflows.
We’re also investing in version control, using tools like Git and Vertex Workbench. This will help us keep track of inputs, parameters, and changes over time - reducing the risk of things accidentally drifting and making it easier to reproduce or review past results.
🔍 Supporting different forecasting needs
Right now, we use the forecast for everything from tracking monthly progress to planning years ahead. These different use cases sometimes require different setups - which has led to slightly divergent versions of the tool.
To fix this, we’re working to:
Document the key use cases and who they’re for
Align on what the forecast should deliver across each time horizon
Build in flexibility, like toggles for short-term vs long-term views and configurable change points, so we can meet multiple needs without fragmenting the codebase
🌍 Scaling across segments and markets
As Monzo grows, we need our forecasting to grow with us. We’re planning to scale the tool to support customer segments and regional views, while avoiding duplicated logic across notebooks.
We’re also looking at how we can model specific behaviours more effectively. For example, student sign-ups show different seasonal patterns compared to other groups, and holidays don’t impact every region in the same way. Building in this nuance will help us make smarter, more localised decisions.
🌡️ Improving validation and outputs
Sense-checking our forecasts has been a big focus so far - and we want to take that even further. We're planning to build in automated validation tools, like MoM and YoY comparisons, to make it easier to spot when something doesn’t look right.
We’re also aiming to streamline how results are shared, reducing the manual steps involved in exporting and importing data across tools like Looker and Google Sheets. Making the outputs easier to manage will reduce error and make it simpler to keep everyone aligned.
🧠 Enhancing the model itself
Looking further ahead, we’re exploring ways to enrich the forecast with new signals. Our Marketing Mix Model has shown us that market trends can have a significant impact on growth - so we’re thinking about how we might forecast those drivers and use them as inputs to improve our acquisition forecast.
In conclusion
Our Growth (acquisitions) forecast at Monzo is a crucial tool, informing both short-term monthly expectations and longer-term, multi-year goal setting. We moved beyond simple methods to adopt and adapt Prophet to fit our business needs.
Our forecast is widely adopted, influencing decisions across Growth, Marketing, Product, and Finance teams. Its accuracy is strong; within tolerances, but has also been critical for spotting significant changes and allowing us to adapt.
We're hiring!
Our Data teams at Monzo continually explore how to drive business impact in a practical and effective way. If you identify with this approach and are considering the next step in your career, we’re hiring! Take a look at our careers page for more info.