At Monzo we run a system that’s made up of hundreds of servers, and thousands of services. With so many components making up the bank, understanding how everything’s performing, and identifying what’s happening when things go wrong can be challenging.
We use tools to monitor everything, from the smallest microservice to the physical servers in our data centres. At its core, we’re interested in taking numerical measurements over time. We call these measurements metrics, and by collecting and storing them together we can gain powerful insights into how everything is working. Critically, we can also use this data to alert our engineers when things don’t look right.
Over the last six months, we’ve been migrating our monitoring and alerting capabilities over to a new monitoring system called Prometheus. Along the way, we went through a few iterations of our setup until we converged on something which offers robustness, high-availability, and long term storage, while maintaining the simplicity we feel is crucial for a monitoring solution.
The solution we’ve settled on has a simple Prometheus server at its core, with additional components built around it to offer the additional functionality we need.
The complete architecture looks something like this:
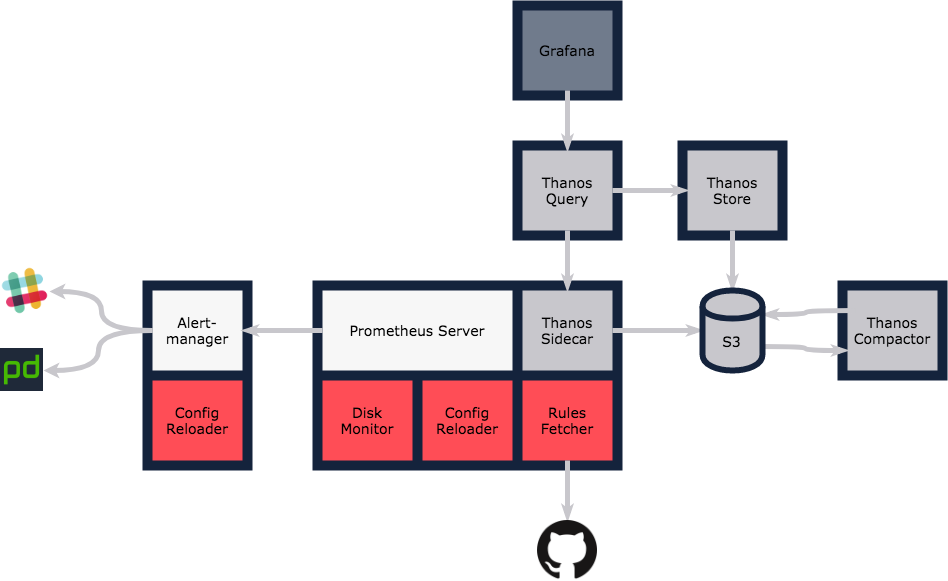
We run everything on Kubernetes, so each outer box represents a Pod, and the boxes within represent individual containers.
As with everything we build at Monzo, we architect for scale and high availability from the outset. With the exception of Thanos Compactor, which itself isn’t critical, all other components can be scaled horizontally to handle increased load and ensure we’re resilient to failure.
Prometheus
Prometheus Server
The Prometheus server is the core component in the monitoring stack. It’s responsible for scraping targets, storing metrics, and providing the interface which allows us to query the data. We’re running a completely standard server at version 2.3.1.
Disk Monitor
We store all of our Prometheus data on persistent volumes, mounted within the Prometheus Pod. The disk monitor container runs the Prometheus Node Exporter configured to collect diskstats/filesystem only. The Prometheus server scrapes the endpoint exposed by this container so we can monitor disk usage against capacity.
Config Reloader
As we’re running on Kubernetes, we use a ConfigMap to store the configuration for Prometheus. When we apply a change to the ConfigMap, the file mounted within the Prometheus server is automatically updated, but by default it requires a manual action to trigger the server to reload. This can be done by sending a SIGHUP or POSTing to the /-/reload endpoint of the server. To avoid this manual step, we deploy a sidecar which mounts the configuration file, watches for changes, and automatically posts to the reload endpoint on change. With this in place, applying the ConfigMap is a sufficient action for Prometheus to be updated and reloaded.
Rules Fetcher
We use Prometheus as our primary tool for alerting and want to make the experience of defining new alerts as frictionless as possible. We store all of our alerts in a Git repo containing the alert definitions, runbooks and any other context which is useful for engineers on-call. While setting up this component we worked backwards from the developer workflow and concluded it should follow:
Raise PR for new alert and runbook
Validate on CI: Check alert syntax with
promtool, validate links to runbook.Merge PR
Alert is Live
The Rules fetcher solves the Merge→Live step by watching master and automatically pulling new alerts to a volume mounted within the Prometheus pod. When an update is synced the config reloader triggers a reload of the server.
Thanos Sidecar
This is covered in the Thanos section below.
Alertmanager
We’re running Alertmanager at version 0.13.0 without modification. We use the same configuration reload mechanism as in the Prometheus server, such that ConfigMap updates trigger an update and reload of the system.
Alert Routing
We have two types of receiver configured in Alertmanager: Slack, and PagerDuty.
We route based on a combination of the owning team and the alert severity. We also send a copy of all alerts to a single Slack channel which serves as a Platform wide event stream.
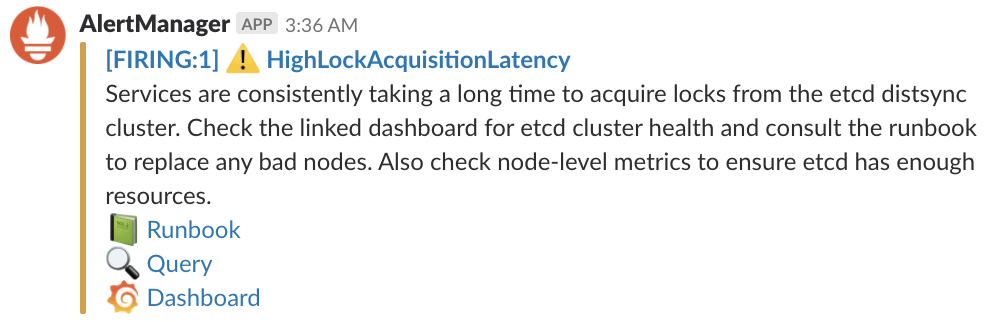
We have a custom template for our alerts which aims to make it easy to find all the required context in the event of an alert firing.
Thanos
The typical approach to high-availability in Prometheus is to run multiple servers doing the same job. If you lose one, you still have a copy of everything running whilst you restore or fix the other. This approach works very well when one server is capable of monitoring everything, but for us that isn’t the case.
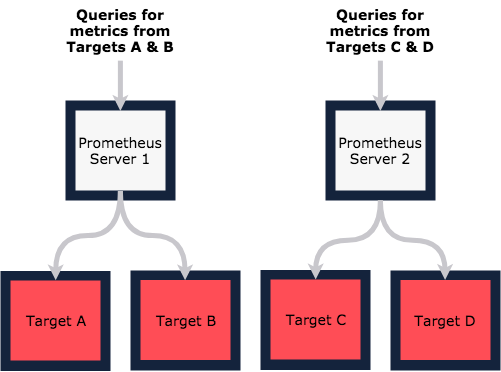
When more than one server is needed to manage the workload, functional sharding is the answer; that is, split your scrapes along functional domains and have different servers responsible for different sets of targets.
The drawback of this approach is that you need to know which server your metrics reside on in order to make queries. Worse still, if you want to join metrics across functional domains you need to introduce an additional server to scrape the two others. It all gets very complex, which is something we definitely want to avoid!
Thanos solves this by introducing a complementary system to run alongside existing Prometheus setups. Using a combination of object storage and a smart query layer, it provides a single, multiplexed view of many Prometheus servers.
Thanos Sidecar
The Thanos sidecar container runs in the Prometheus Pod, and mounts the Prometheus data directory through a shared volume. Prometheus periodically writes its data for a fixed time window to immutable block files. The sidecar is responsible for backing up these files to object storage (S3 in our case) and acting as a local data source for the global Thanos Query component.
The Thanos query component provides a Prometheus native interface for requesting data from multiple distinct Prometheus servers. Queries made through this component fan out to other Prometheus Pods and request data through the Thanos sidecar. If the data is available on the local volume, it’s returned to Thanos Query where results are merged and returned to the user/system making the original request.
The combination of Sidecar and Query components solves the single-view problem, as well as backing up the data to S3.
Thanos Store
Thanos store acts just like a sidecar, in that it represents a source for metrics data. The main difference is that, while the sidecar acts as a proxy for data locally available from a Prometheus server, Thanos store acts as a gateway for data stored remotely in S3.
With this component in place, queries made through Thanos Query fan out to both the Thanos Store and Thanos Sidecar components, providing not only a seamless view across Prometheus servers, but also one across a long term time window (for as long as you keep data in S3).

Thanos Compactor
The final piece of the puzzle is Thanos Compactor, which is responsible for compacting and downsampling data stored in S3, to help with efficient querying over long time periods. I won’t go into the details of how and why, but if you’re interested read this!
Grafana
There’s not much to say here. We run a standard Grafana instance, with dashboards created by hand. We periodically back the data up to ensure we don’t lose anything, and have plans to move some of the more static dashboards to config as code. It just works!
To find out more or discuss this with Chris, have your say in the community or find him on Twitter @evnsio 📣