To keep Monzo running smoothly and continue serving the needs of our customers, it's important our technology platform is scaled appropriately. Practically speaking, when you do anything with your Monzo account, like open the Monzo app or use your debit card, a computer server in our platform has to do some work. There’s a limit to how much work each server can do, so when more customers do more things we need to add more servers.
We've built Monzo in the cloud so we can take advantage of near-infinite capacity, but it is our responsibility to determine exactly what resources we need. We've been on a journey from setting this manually to today where we rely on automated systems to take care of this for us.
We’re building Monzo on microservices and Kubernetes
It’s no secret that Monzo is all-in on microservices on Kubernetes. In fact, almost every system we run does so on top of Kubernetes, with the only notable exceptions being some stateful infrastructure like Cassandra and etcd. There are many reasons why Kubernetes works well for us:
Standard APIs for managing software: Kubernetes provides a consistent API for deploying, maintaining and interacting with applications. We’ve become very efficient at operating software using Kubernetes primitives.
Built-in resiliency primitives: Kubernetes solves many of the resiliency concerns that operators of distributed systems need to think about. Built in controls loops manage the software running in the cluster to constantly close the gap between the declared state and what’s observed live. Having our microservices auto-heal in the face of failures in the underlying infrastructure is both powerful and necessary when operating at scale.
Efficient use of infrastructure: Historically, operators had to decide where to run their application to make best use of the underlying infrastructure. With more monolithic applications, it was reasonable to run each application with a 1:1 mapping against a particular server. With the introduction of service-oriented architectures, running each instance of a microservice on its own server would be enormously inefficient*. Kubernetes helps by managing the placement of workloads into a cluster, with operators only needing to define how much CPU and memory each needs.
*I’m deliberately excluding more recent developments in virtualisation like Firecracker
Sizing things appropriately is hard
Kubernetes uses a bin packing algorithm to decide where to run each workload. It knows what capacity is free on each server in the cluster, and when an operator deploys something new, it considers how big it is and where it would fit best.
Conceptually, if each server in the cluster is represented by a van, and each workload as a box to be packed into a van, Kubernetes is responsible for deciding which box goes which van. This is a robust process, but it begs the question: as an application owner, how do I know how big to make my box?

Typically, the process goes something like:
Make an educated guess
Get it wrong
Wait for your service to exhaust its allocated resources
Add a generous margin so it never* happens again
*it always happens again. This process is rarely a one-off; changes to the service itself, changes in how it’s used, and/or growth in users mean it’s likely you’ll need to reassess the requirements of your service on an ongoing basis.
We’re autoscaling for efficiency and resiliency
When we look at tackling this problem, we’re trading off two factors; efficiency and resiliency. To be efficient with our underlying infrastructure we want to make everything as small as possible, but this often comes at the cost of resiliency as there’s little headroom to deal with deviations in usage. Conversely, we could be resilient by significantly overprovisioning everything, but this is an inefficient use of infrastructure which leads to higher costs.
Fortunately, deciding how ‘big’ a service should be is something of a solved problem in Kubernetes, and we can measure ‘bigness’ both vertically, which is the amount of resources each pod needs, and horizontally which is the number of replicas we run.
The building blocks of autoscaling in Kubernetes
Applications in Kubernetes are typically described by a Deployment:

In the context of scaling we care about the number of replicas, which indicates how many copies of this service there should be, and the resource requests, which says how much CPU and memory should be allocated to each one. We can tune these manually, or we can employ the Vertical- and Horizontal Pod Autoscalers to do it for us.
Getting the right sized box
The Vertical Pod Autoscaler is a system that manages the request size for each pod. It operates on Kubernetes objects like deployments; taking CPU and memory usage from pods and using them to build an internal model. From this it creates a recommendation for the amount of CPU and/or memory for each container. As a result, pods are scheduled with a size that matches their usage on an ongoing basis.
Due to some constraints in the way resource requests are currently applied in Kubernetes, the VPA has a few moving parts:
Recommender: This is the brains of the VPA; it’s responsible for observing the resource usage of containers, aggregating by deployment and producing a model that represents the optimal request for each. This component is entirely passive and its sole purpose is to produce recommended values. As a result, it can be deployed as a standalone item and used purely in an advisory capacity — for example to define an alert that compares the requests of containers against the recommendations.
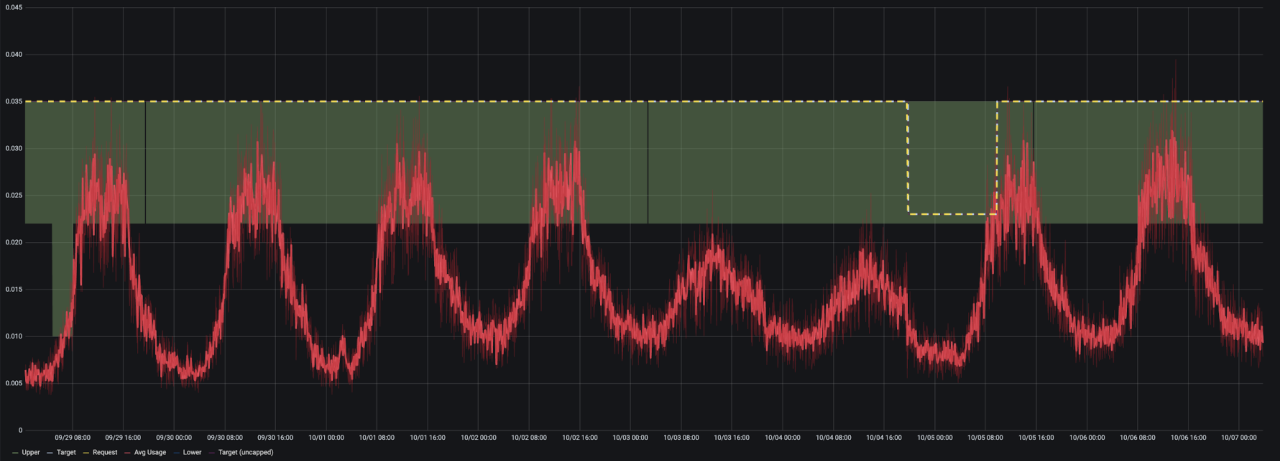
The green region highlights the range of the lower-upper bounds. The red is the current usage, and the dotted lines represent the target and actual requests for the container.

Updater: The updater’s job is to compare the live requests of containers against the values produced by the recommender. If the current request of a container is far from where it should be*, the updater's job is to evict the pod from the node. Why does it evict them? Because Kubernetes doesn’t currently allow requests to be changed dynamically on live running pods, so the only way to update a request is to create a new pod with different values.
*there are a few conditions that determine “far from where it should be” but primarily it considers whether the current request value falls within the region defined by the lower/upper bound in the recommender model.
Admission Controller: The admission controller is a standard Kubernetes mutating admission webhook. Sounds a bit scary, but it’s just a HTTP handler that is called before pods are scheduled onto nodes. In the body of the HTTP call is the specification of the pod being admitted, and the VPA admission controller’s job is to inspect the pod, determine whether it is being controlled by the VPA and if so, set the request value to the one suggested by recommender.
The combination of these three components leads to containers having their requests set to an appropriate value on an ongoing basis. One drawback of the design is that pods need to be evicted (i.e. stopped and rescheduled) each time their requests need to be changed. If you’re running your application on Kubernetes, this kind of disruption shouldn’t be overly concerning, but there are some pitfalls here that we’ll cover later!
Getting the right number of boxes
Compared to the VPA, the HPA is a much simpler component to understand. At the simplest level its job is to look at the live resource usage of pods and determine the number of replicas that are required to satisfy a predetermined threshold. For example, we could define that we want our pods to operate at 70% CPU utilisation, meaning they’re using 70% of the total requested CPU. If utilisation exceeds 70%, the HPA will add more replicas, and likewise if it drops below 70% it’ll remove some.
Unlike the VPA, the built in metrics it uses operate at the pod level and not on individual containers. It is also a built-in component of Kuberetes, and is configured with flags defined on the Kube Controller Manager.
The HPA is a flexible system, and if you’re prepared to tackle the complexity of extension API servers and custom metrics, you can scale your replicas based on pretty much anything you can measure!
Combining autoscalers for a better user experience
At Monzo, every one of our microservices is built from the same framework and compiled into a statically linked binary running in a scratch Docker container. Every service is deployed in the same way too, with a Kubernetes deployment specifying two containers: one for the service itself, and the other for the envoy sidecar that underpins our service mesh. All of this is deployed and scaled with our internal tooling.
When we introduced autoscaling there were some fundamental properties we wanted:
The scaling of envoy sidecars must be transparent to service owners - it’s a component of the platform and should just work.
Irrespective of scaling mode, both the envoy and service containers should automatically respond to OOM kill events and scale their memory up accordingly.
Whilst we have a preference for horizontal scaling, service owners should be able to select the most appropriate scaling mode for their workload. There may be good reasons for scaling something manually, or choosing vertical over horizontal autoscaling.
With this in mind, we built three modes of auto-scaling into our Platform tooling, each using different combinations of the VPA and HPA.
| Scaling Mode | How it works | VPA | HPA |
|---|---|---|---|
| Manual | Service owners have full control and can set the resource requests and replicas manually. | Off — recommender system produces values, but they aren’t applied | Off |
| Vertical | Service owners set the number of replicas, and the minimum CPU and memory requests for their service. The VPA autoscales the service container based on these constraints, and the envoy container based on a standardised resource policy. | On — the VPA is producing recommendations, and they are applied to all containers in service pods | Off |
| Horizontal | Service owners specify the min and max number of replicas, and a fixed CPU request for their service container. The HPA scales based on a 70% utilisation target. The VPA is responsible for scaling the memory of the service container, and both the CPU and memory of the envoy container. | On — the VPA is managing the memory of both containers in the pod, and the CPU of the envoy container. | On - the deployment is autoscaled based on the CPU utilisation of the service container in each pod. |
Using these modes, a common flow has emerged for services across the Monzo platform.
When first created, we deploy services in a default configuration of Vertical mode with three replicas. Many of our services can comfortably carry out their duties with three replicas requesting no more than 10 millicores each, so this becomes the most efficient starting point. As a service is developed to do more and/or it becomes increasingly depended on by others, the VPA manages scaling up requests over time. If a service becomes part of a critical path, or the load patterns become variable (for example if it becomes part of the mobile app launch flow) it’s common for it to be switched to Horizontal mode so it can scale more dynamically with demand.
Auto-autoscaling ✨
Our long term aim is for resource requirements to be a consideration of the platform and not service owners. There’s huge scope to drastically improve what we have today, including the introduction of predictive algorithms and machine learning, but there are also some small improvements we’re working on to improve the experience with the components we already have. To do this, we’re building an opt-in control mechanism to manage the transition between scaling modes automatically for service owners. The finer details are still in development, but ‘mode triggers’ will allow us to define rules to move services between scaling modes when it makes sense.
It hasn't all been smooth sailing scaling
As can be expected, automation doesn’t come without its own costs. Since we introduced autoscaling into the Monzo platform we’ve experienced our fair share of edge cases and undesirable behaviours. In the hope that it’s helpful to others following a similar path, here are some of the issues we’ve had along the way.
Evicting pods without a rate limit
When we first deployed the VPA we had it deployed as ‘Off’ for all workloads. This meant the recommender was producing recommended requests for each targeted container, but they weren’t being applied to running pods. Once we were happy the recommendations were appropriate and the system was working as expected, we enabled ‘Auto’ mode, where the updater would start evicting pods that needed an update.
This resulted in thousands of pods being evicted in quick succession with no limit on how fast the process could go. We contributed a fix for this, allowing eviction rate limits to be configured on this component.

Evictions don’t respect deployment rollout strategies
The VPA uses the Kubernetes eviction API to remove pods from nodes, which doesn’t respect the rollout strategies of Kubernetes Deployments. Whilst our deployment rollout strategies are configured to ensure replicas of a service are always available and ready to serve requests, the eviction mechanism of the VPA can result in all replicas of a given service being evicted simultaneously. Fortunately newly scheduled services start quickly, which meant instances of this issue were rare, but for larger services this might pose some more serious problems.
The workaround was simple using the Kubernetes primitive of a Pod Disruption Budget (PDB). With this we can define how many pods of deployment we want to ‘disrupt’ (have unavailable) due to voluntary evictions. For example, if we want only a single replica of a service to unavailable at a time, we’d configure something like this:

With these in place for each of our services, a VPA eviction wouldn’t be able to render more replicas than we allow to be unavailable at any time.
Failing to get historical metrics from Prometheus
The VPA uses historical usage metrics to determine the recommended resource requests for containers. It can be configured to retrieve history from Prometheus, or to persist its model as a ‘checkpoint’ using a Kubernetes custom resource.
As we use Prometheus and had historical container metrics available, we configured the VPA to use the Prometheus history provider. This worked fine initially, but as described in this issue on GitHub, it’ll fail in large clusters. When this happens, the history used by the VPA is linked to the duration of time the VPA recommender has been running. The shorter the VPA is running, the more volatile the recommendations, and the greater the likelihood of pods being evicted.
In itself this is far from ideal, but with the three VPA components configured to vertically scale themselves, we found a degenerate edge case whereby the history load on start failed, leading to the VPA recommender building its model from scratch on each restart, leading to volatile recommendations and increased evictions, leading to recommender itself being evicted.
The graph below highlights the situation over the period of a month. The line shows the number of evictions we had occurring over an hour (peaking at > 1000) and each colour represents a new instance of the VPA updater, which indicates how often the VPA components themselves were being evicted.

For context, here’s what a typical month looks like now.

It’s equal parts impressive and worrying that this level of disruption can have zero negative impact on the operation of the bank, and all thanks to Kubernetes keeping the right things running at all times.
Accidentally combining autoscalers
When we first rolled out our Horizontal scaling mode, we selected a group of stateless, vertically scaled microservices to trial the behaviour. We automated the migration between modes by setting the CPU request and min replicas equal to the value currently set on in Vertical mode, and allowed the max number of replicas to scale to double the minimum. For example, a service in vertical mode with three replicas of 10 millicores each would be migrated to horizontal mode with three replicas minimum, 6 replicas maximum and 10 millicores each.
As a reminder, in our Horizontal mode, we have the HPA operating on service container CPU usage, and the VPA operating on both the service container memory, and the CPU and memory for envoy.
When we initially rolled out this change, we used a default HPA configuration to set a target CPU utilisation of 70%, not appreciating that this considered the utilisation of the pod as a whole, and not just the service container. What this meant was that for pods where the sum of requests was small, work done by envoy alone (for example consuming and processing updates about downstreams) was enough to trigger the HPA to scale up.

Whilst this is advised against, you might wonder how dire the consequences can be. In our case the interaction between autoscalers led to some undesirable, but fortunately benign scaling behaviour. The resolution was straightforward too: we used our custom metrics adapter to expose a metric for the pod CPU utilisation, considering only the usage and request of the service container.